I was immediately intrigued by the small pillars of sand underneath a dripping rock overhang at our Poncho’s Kitchen campsite (RM 139). At first look, they appear to be piles of sand that precipitated from the dripping seeps coming out of the sandstone above. They are actually a more complicated phenomenon—each one has a rock at the pinnacle of the pillar, and that rock has prevented the sand underneath from eroding. Since the rocks deflect water at angles determined by drip velocity, gravity and rock surface roughness, I presume that there is a predictable relationship between rock diameter, pillar base diameter and pillar height. I took measurements of 30 different pillars at three separate sites of varying distances from the dripping rocks to see if there is a pattern in the pillars’ dimensions. I predict that the pillars will increase in height as distance from the drip increases, causing drip velocity to increase. I also predict that within each site, rock-diameter-to-pillar-height will be regularly distributed around a mean.
I measured rock diameter as the average diameter in mm if a rock was asymmetrical. The pillar height is measured in mm at the maximum height if the pillar is on a slope. The pillar base diameter is measured in mm, and averaged if the base is asymmetrical. I measured ten representative pillars at each of three sites. Each site was progressively farther from the dripping sandstone overhead, meaning that the water was probably moving at higher velocity when it hit the sand at site 3 than at site 1. I calculated averages for all values at each of the three sites.
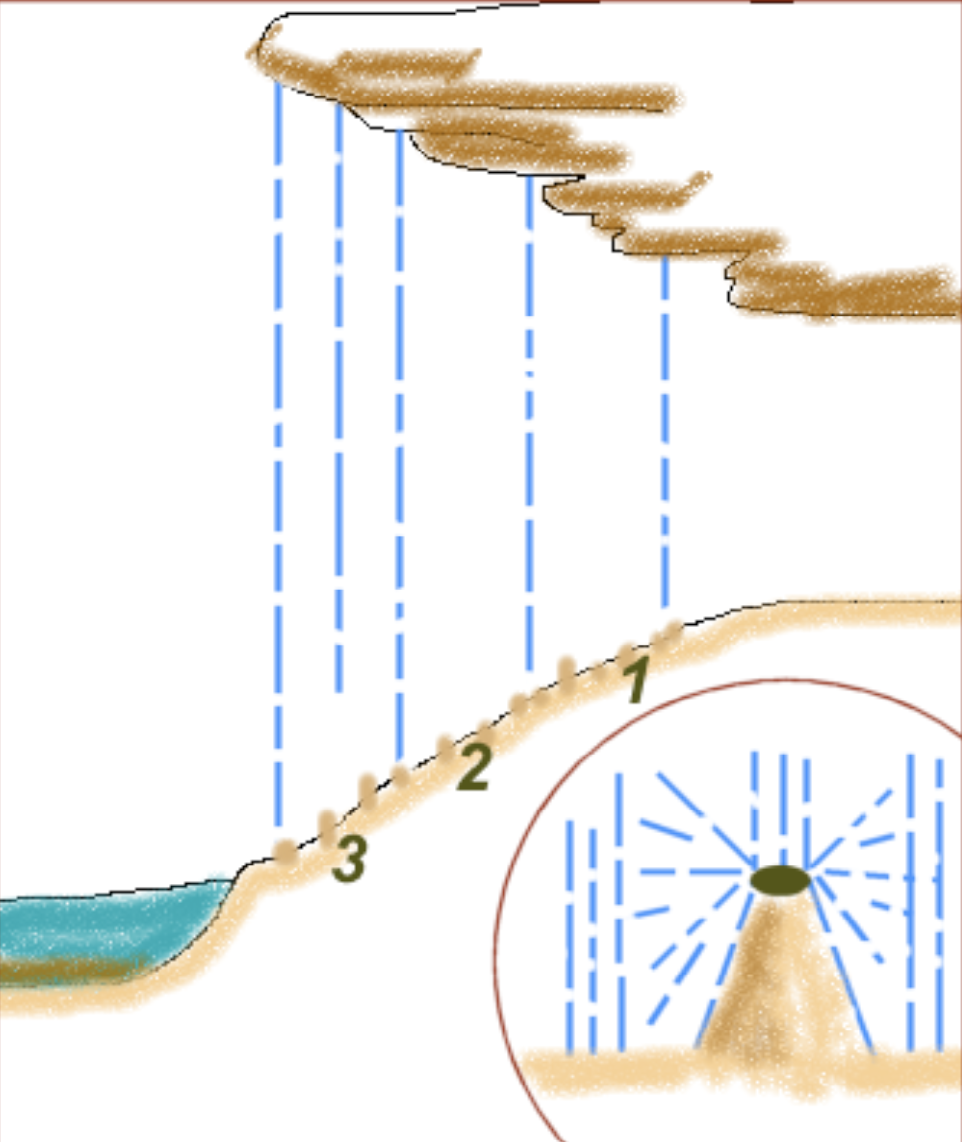
Left: Placement of sample sites. 3 is closest to river and 1 is farthest up on shore. Dripping sandstone overhang is shown above.
Inset: Pedestal formation. Water drips onto rock, and deflects at varying angles, eroding sand at those angles.
My results are shown on the last page. I was able to reach some conclusions which are summarized in the data table. There were varying degrees of spread (kurtosis) around the mean values, but there were some general patterns:
-
In all three sites, rock diameter is strongly centered on a mean and increases significantly from site 1 to site 3. Rock diameter is obviously not determined by the dripping water, but this result may mean that rock diameter increases from bank to shore. This could mean wind and water selecting for larger diameter pebbles and rocks nearer to the zone of inundation.
-
In all three sites, base diameter is strongly centered around a mean. This is not surprising because if rock size at each site is standard, then base diameter should be standard because the angle of water deflection is fairly constant (determined by physics).
-
The average base-to-rock-diameter ratio is different at each site, and is probably significant since rock and base diameters are fairly narrowly distributed about each site’s mean. The base-to-rock ratios characteristic of each site are listed in the data table.
-
Pedestal heights are progressively higher from site 1 to site 3. This makes sense because water is probably reaching a higher velocity as it falls from a longer distance to reach site 3. It therefore erodes the sand surrounding the pedestals to a lower depth.
I found more erosional pedestals at our final campsite, but these were produced by rain. They were smaller and more uniform, possibly because rain is more evenly distributed and less targeted than a constantly-dripping seep that creates dramatic pedestals like those at Poncho’s Kitchen.
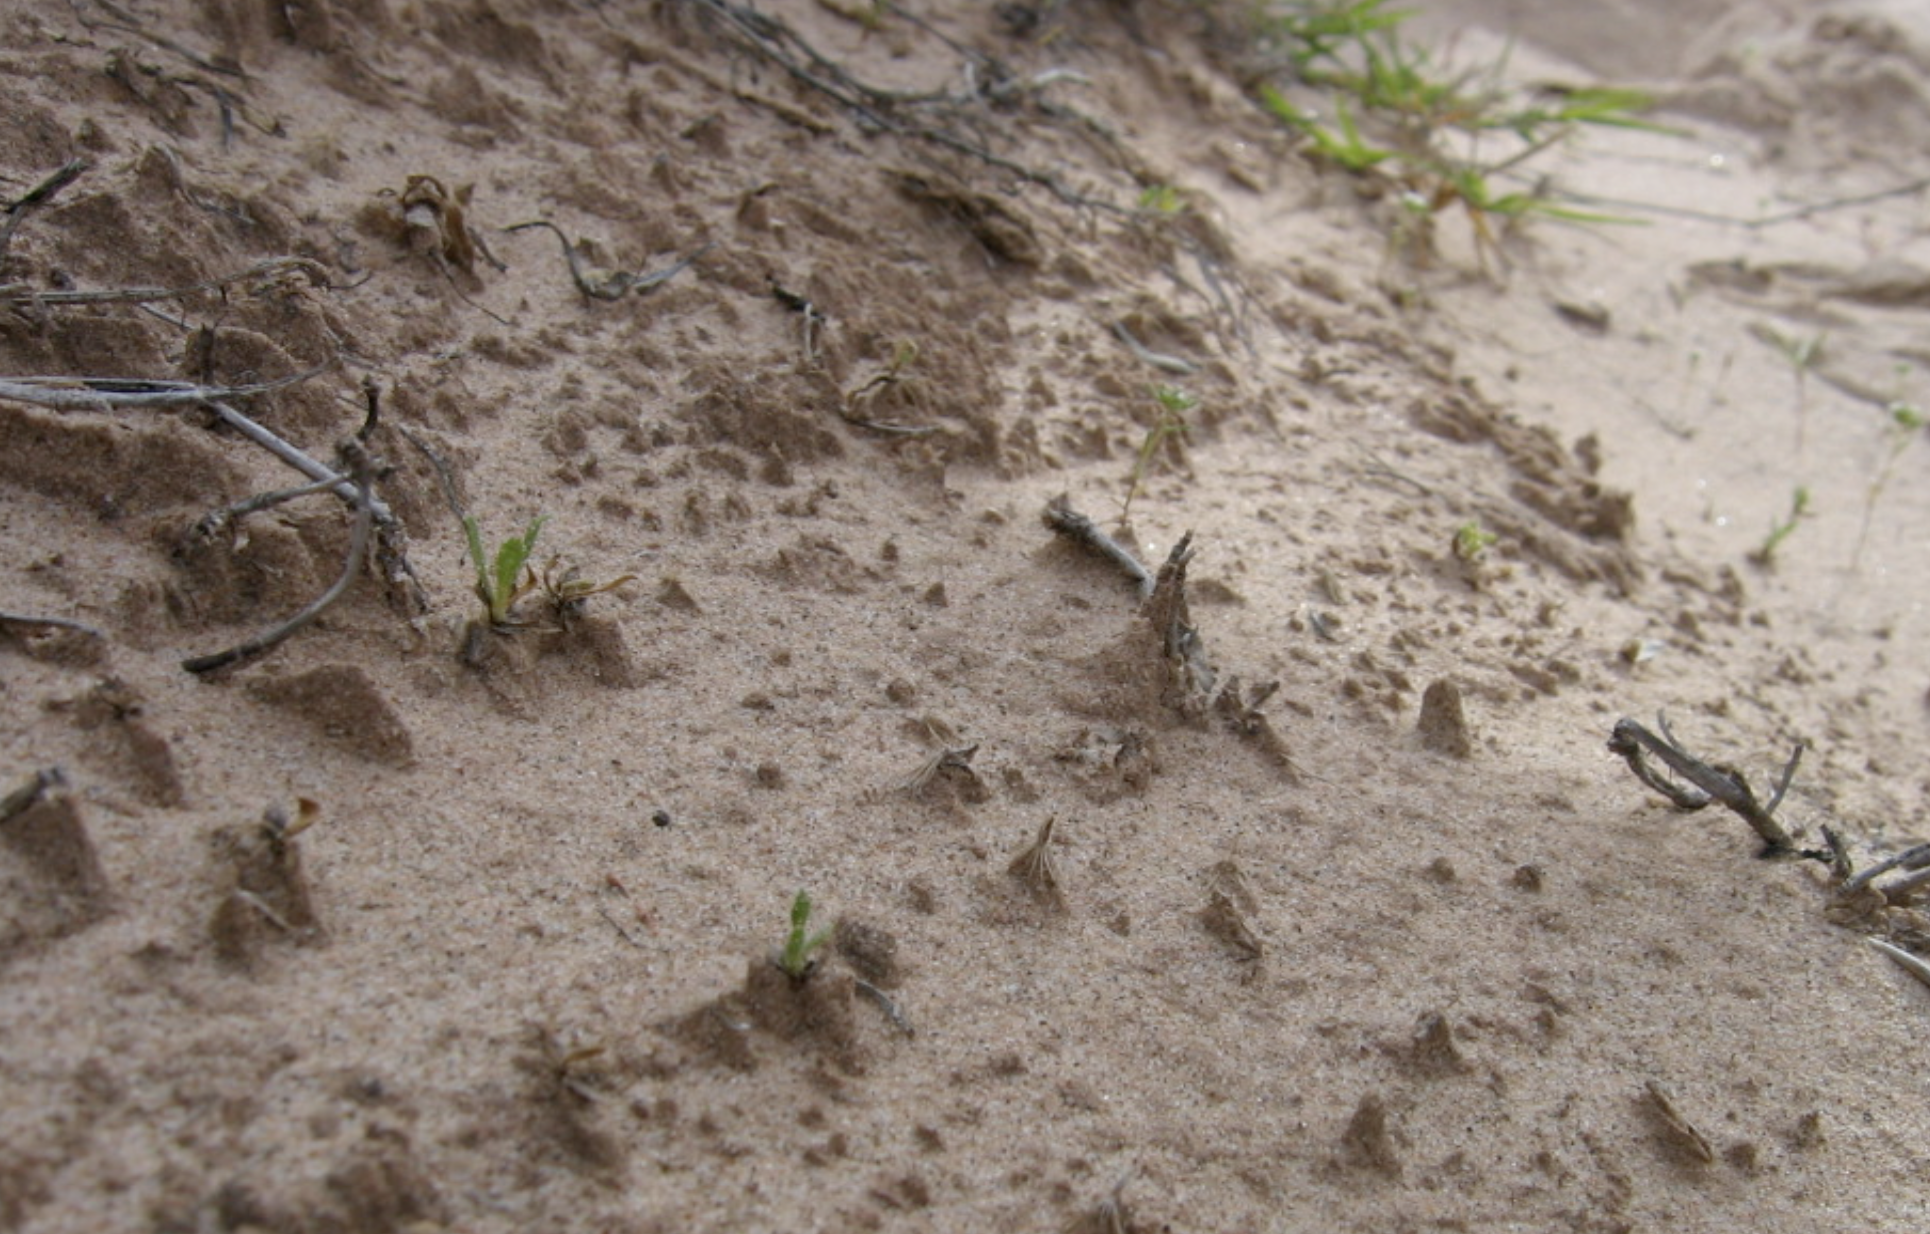
Left: Erosional pedestals created by rain. Smaller and more uniform than those created by seeps above Poncho’s kitchen.
Data Table:
| Site 1 | ||||||
|---|---|---|---|---|---|---|
| rock d, mm | pillar h, mm | base d, mm | rockd/ based | rockd/ pillarh | Notes | |
| 6.00 | 45.00 | 35.00 | 0.17 | 0.13 | Base diam is about 4 times | |
| 5.00 | 35.00 | 30.00 | 0.17 | 0.14 | the rock diam | |
| 7.00 | 50.00 | 34.00 | 0.21 | 0.14 | Pillar height is about 5 times | |
| 10.00 | 27.00 | 30.00 | 0.33 | 0.37 | the rock diam | |
| 8.00 | 49.00 | 31.00 | 0.26 | 0.16 | Rocks are small | |
| 19.00 | 73.00 | 38.00 | 0.50 | 0.26 | Bases are small | |
| 3.00 | 65.00 | 35.00 | 0.09 | 0.05 | Pillars are short | |
| 8.00 | 32.00 | 30.00 | 0.27 | 0.25 | Rock diameter and base | |
| 20.00 | 75.00 | 40.00 | 0.50 | 0.27 | diameter are fairly centered around the mean. | |
| 5.00 | 25.00 | 20.00 | 0.25 | 0.20 | Pillar height is variable. | |
| average | 9.10 | 47.60 | 32.30 | 0.27 | 0.20 | |
| stdev | 5.820462 | 18.41014 | 5.558777 | 0.136906 | 0.091808 | |
| variance | 33.87778 | 338.9333 | 30.9 | 0.018743 | 0.008429 | |
| kurtosis | 0.564499 | -1.30512 | 1.983571 | -0.13666 | 0.279426 | |
| good | bad | great | fair | good | ||
|
Site 2 |
||||||
| 11.00 | 52.00 | 40.00 | 0.28 | 0.21 | Base diam. is slightly more than 5 times the rock diam. | |
| 11.00 | 120.00 | 55.00 | 0.20 | 0.09 | ||
| 7.00 | 115.00 | 43.00 | 0.16 | 0.06 | Pillar height is about 6 times the rock diam. | |
| 25.00 | 125.00 | 100.00 | 0.25 | 0.20 | ||
| 8.00 | 50.00 | 40.00 | 0.20 | 0.16 | Rocks are intermediate sizes | |
| 10.00 | 70.00 | 54.00 | 0.19 | 0.14 | Bases are intermediate diameter | |
| 12.00 | 75.00 | 58.00 | 0.21 | 0.16 | ||
| 12.00 | 48.00 | 40.00 | 0.30 | 0.25 | Pillars are intermediate height | |
| 11.00 | 80.00 | 60.00 | 0.18 | 0.14 | Rock diameter and base diameter are fairly strongly centered around mean. | |
| 9.00 | 35.00 | 37.00 | 0.24 | 0.26 | Pillar height is variable. | |
| average | 11.60 | 77.00 | 52.70 | 0.22 | 0.17 | |
| stdev | 4.993329 | 32.69047 | 18.70858 | 0.0443 | 0.06375 | |
| variance | 24.93333 | 1068.667 | 350.0111 | 0.001962 | 0.004064 | |
| kurtosis | 7.214701 | -1.36644 | 4.847785 | -0.68354 | -0.65343 | |
| excellent | bad | great | fair | fair | ||
|
Site 3 |
||||||
| 45.00 | 130 | 75 | 0.6 | 0.35 | Base diam is about twice the rock diam. | |
| 23 | 85 | 50 | 0.46 | 0.27 | ||
| 145 | 140 | 185 | 0.78 | 1.04 | Pillar height is about 3 times the rock diam. | |
| 11 | 80 | 35 | 0.31 | 0.14 | Rocks are large | |
| 10 | 72 | 40 | 0.25 | 0.14 | Bases are large diameter | |
| 14 | 74 | 36 | 0.39 | 0.19 | Pillars are highest | |
| 18 | 80 | 36 | 0.50 | 0.23 | Rock diameter and base diameter are fairly strongly centered around mean. | |
| 10 | 115 | 65 | 0.37 | 0.21 | ||
| 24 | 115 | 65 | 0.37 | 0.21 | ||
| 48 | 125 | 85 | 0.56 | 0.38 | Pillar height is variable. | |
| average | 34.80 | 101.60 | 66.20 | 0.44 | 0.30 | |
| stdev | 41.08203 | 25.8938 | 45.23715 | 0.179352 | 0.273915 | |
| variance | 1687.733 | 670.4889 | 2046.4 | 0.032167 | 0.07503 | |
| kurtosis | 7.06946 | -1.88835 | 6.213777 | 0.049296 | 7.032219 | |
| excellent | bad | great | OK | excellent |