Sandbars are one of the most important resources within the Grand Canyon because of their value for habitat to everything from humpback chub to cottonwood to river rafters. The adaptive management program of Glen Canyon Dam has echoed this idea by trying to conserve sandbar resources in the form of beach-building flood releases. However, every other flow regime has led to the continuing decrease of sandbar size, complexity, and sustainability. The mode of these failures, namely seepage erosion leading to Coulomb-type slope failures, needs to be understood in order to find a potential solution to this loss of a vital resource.
Seepage erosion is a common occurrence in the Grand Canyon due to the enormous fluctuations in flow caused by electricity generation at Glen Canyon Dam. This fluctuation was very large during our journey down the Grand Canyon. Starting January 1, 2005 and ending April 7, 2005, non-native fish suppression flows are released from Glen Canyon Dam and consist of a daily fluctuation of 5,000 cfs to 20,000 cfs. Seepage erosion occurs during the drawdown period when water in the river channel drops at a substantially higher rate than the water within the pores of the sandbar. The rate is substantially higher because the moment a drop in the river stage occurs, there is not an instantaneous draining of the sandbar to even the water levels out due to the small sand particles inhibiting the movement of water. The difference in water level between the river channel and the sandbar increases as the drawdown continues. This increase leads to instability because the pore water pressure in the saturated part of the sandbar no longer has a full river to balance out the pressure forces. Finally, this instability can lead to a Coulomb- type slope failure when the pressure forces are too great and the sandbar shears off into the river channel. These types of failures can be quite devastating and huge areas of a sandbar can be lost in a few seconds.
In order to better understand the phenomenon of seepage erosion, the differences between river stage and sandbar stage were observed during drawdown at RM 123L. The stage in the river channel was measured by a PVC pipe driven into the channel bottom with 0.1 foot graduations drawn onto the outside to read. The stage of the sandbar was measured using a shallow piezometer made from a 6-ft section of _” PVC pipe. At this site, the piezometer was driven into the sandbar at the current high flow level (~21,000 cfs), which was approximately 11.5 m away from the current low flow level (~9,000 cfs). See Figure 2 for a picture of the site setup. Figure 3 shows the stage readings through time and shows a significant difference in the rate of drawdown between the river and the sandbar. Once the river stage bottomed out at 1 foot, the sandbar stage was almost 3 feet higher in elevation. Even though this site did not experience slope failure, the basic principles behind seeing the significant difference in rates of drawdown can be used for most sandbars in the Grand Canyon.
Seepage due to differences in drawdown rates was also observed at the upstream sandbar at Crystal Rapid (RM 98). A video was taken of the boils seeping up from the ground approximately 1 ft above the current low flow level (~8,000 cfs). Figure 4 shows several of the boils within this area at approximately 8,000 cfs. The diameter of the boils was approximately 2- 4 inches. Due to fact that this area would be inundated at flows greater than 10,000 cfs and that no natural springs exist at this site from anecdotal evidence, the boils are most likely due to the seepage caused by the intense drawdown of the river stage.
From numerous observations along our trip, seepage is still a common occurrence in the sandbars of the Grand Canyon. These sandbars are created by a short-lived flow regime consisting of a flood large enough to deposit sand at high elevations but are constantly being eroded by a different fluctuating flow regime that induces significant seepage erosion. Unstable sandbars similar to the one in Figure 1 are very common along the Grand Canyon and will continue to be common under the current flow regime from Glen Canyon Dam.
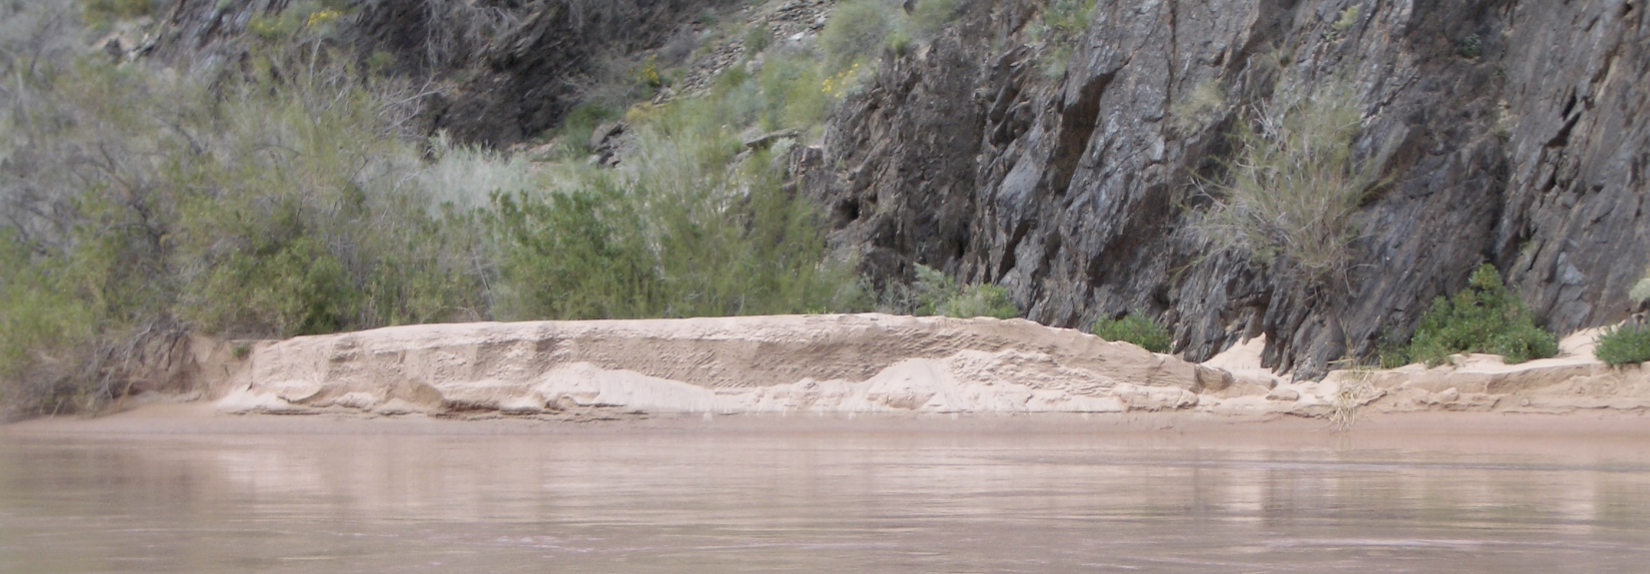
Figure 1. Coulomb-type slope failure.
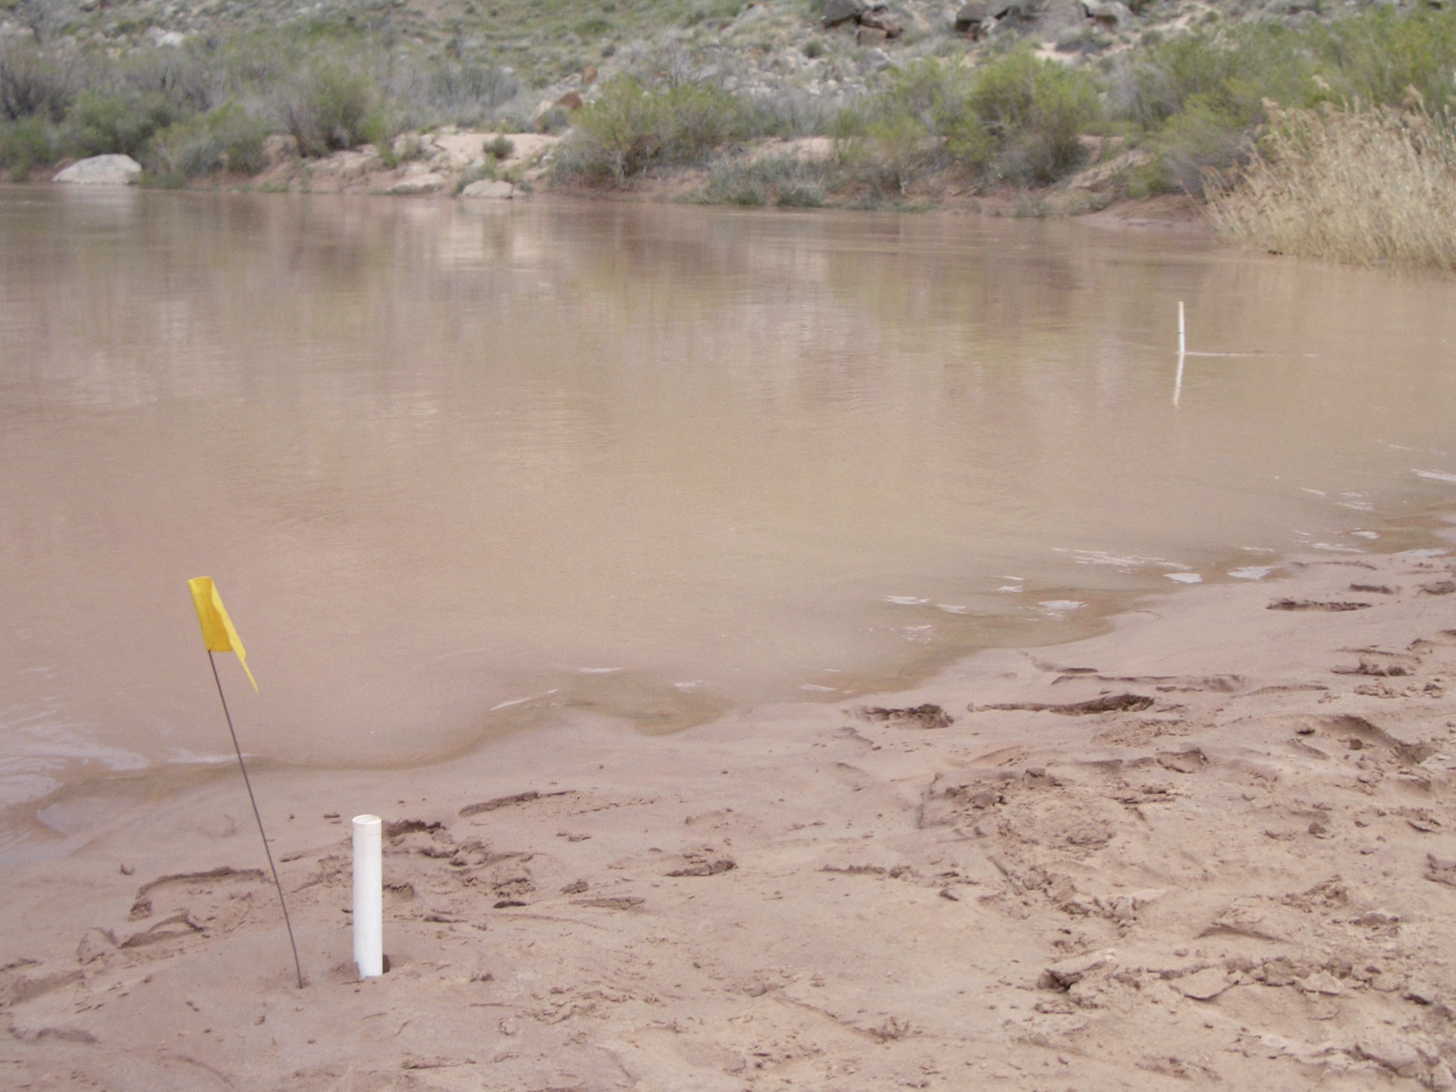
Figure 2. Setup of experiment to measure river stage and sandbar stage fluctuations during drawdown.
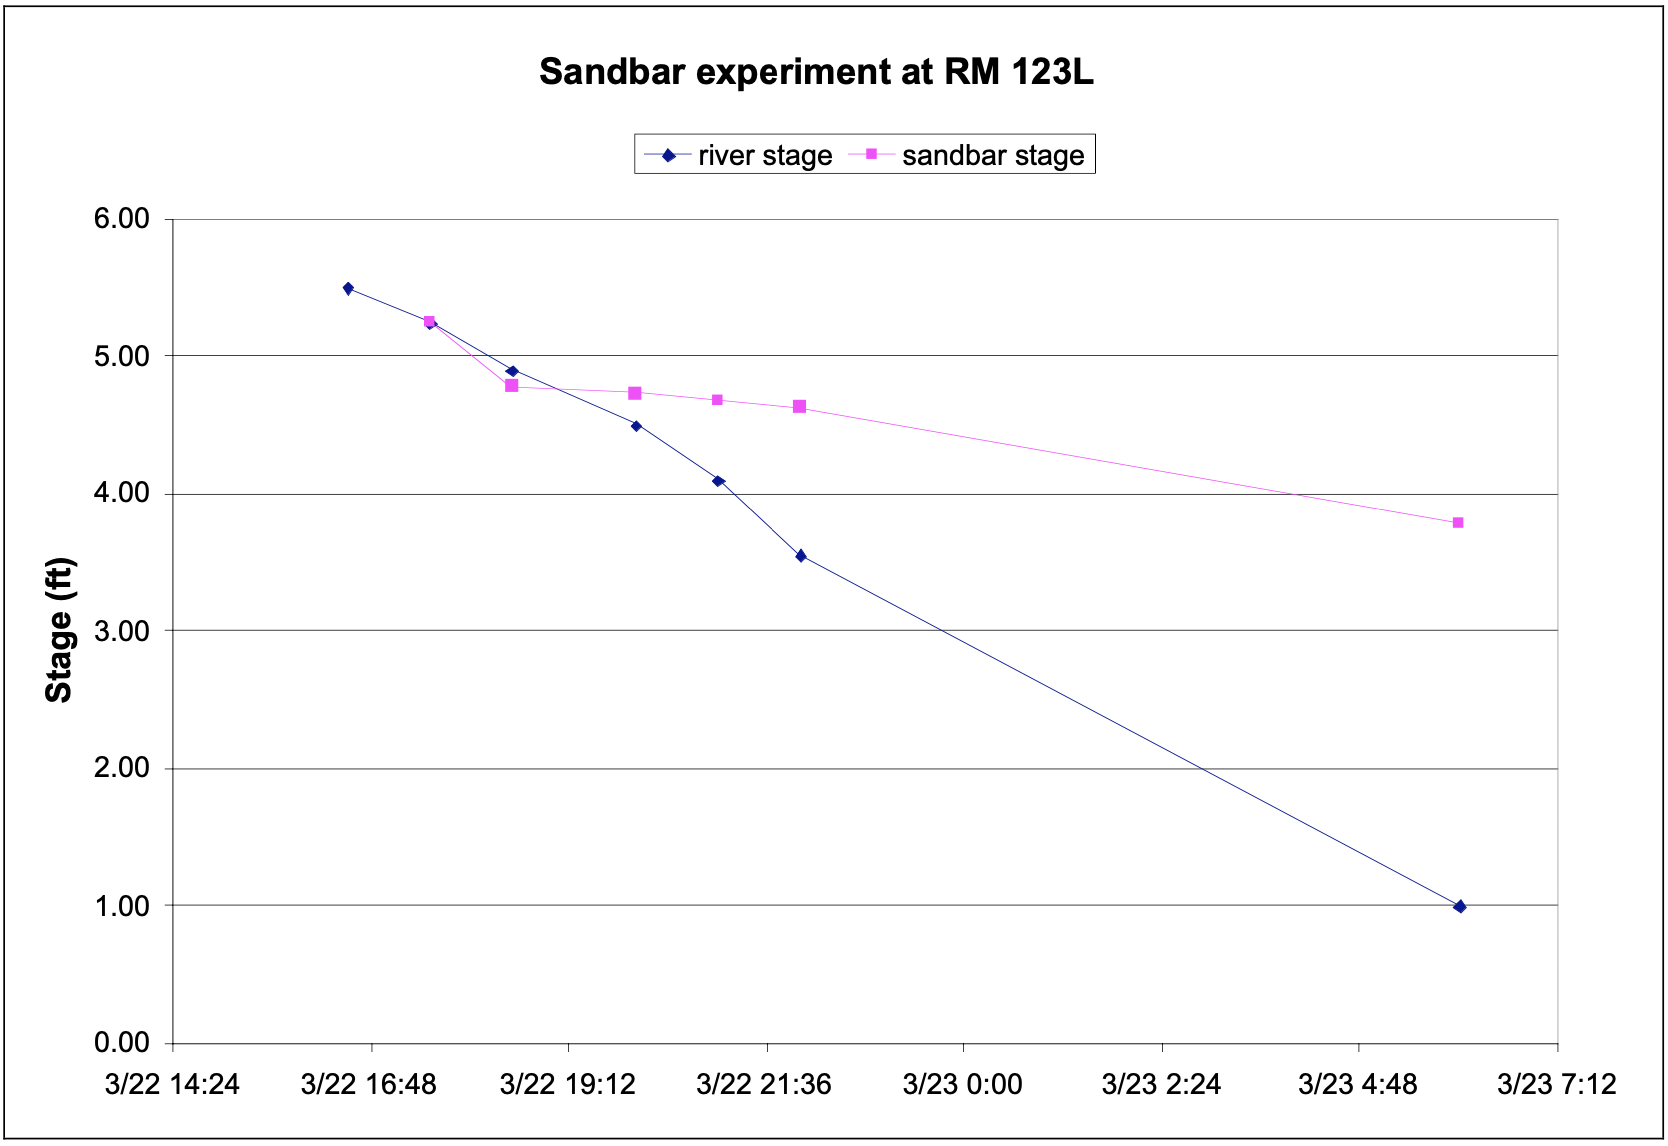
Figure 3. Change in stage with time for the river channel and the sandbar.
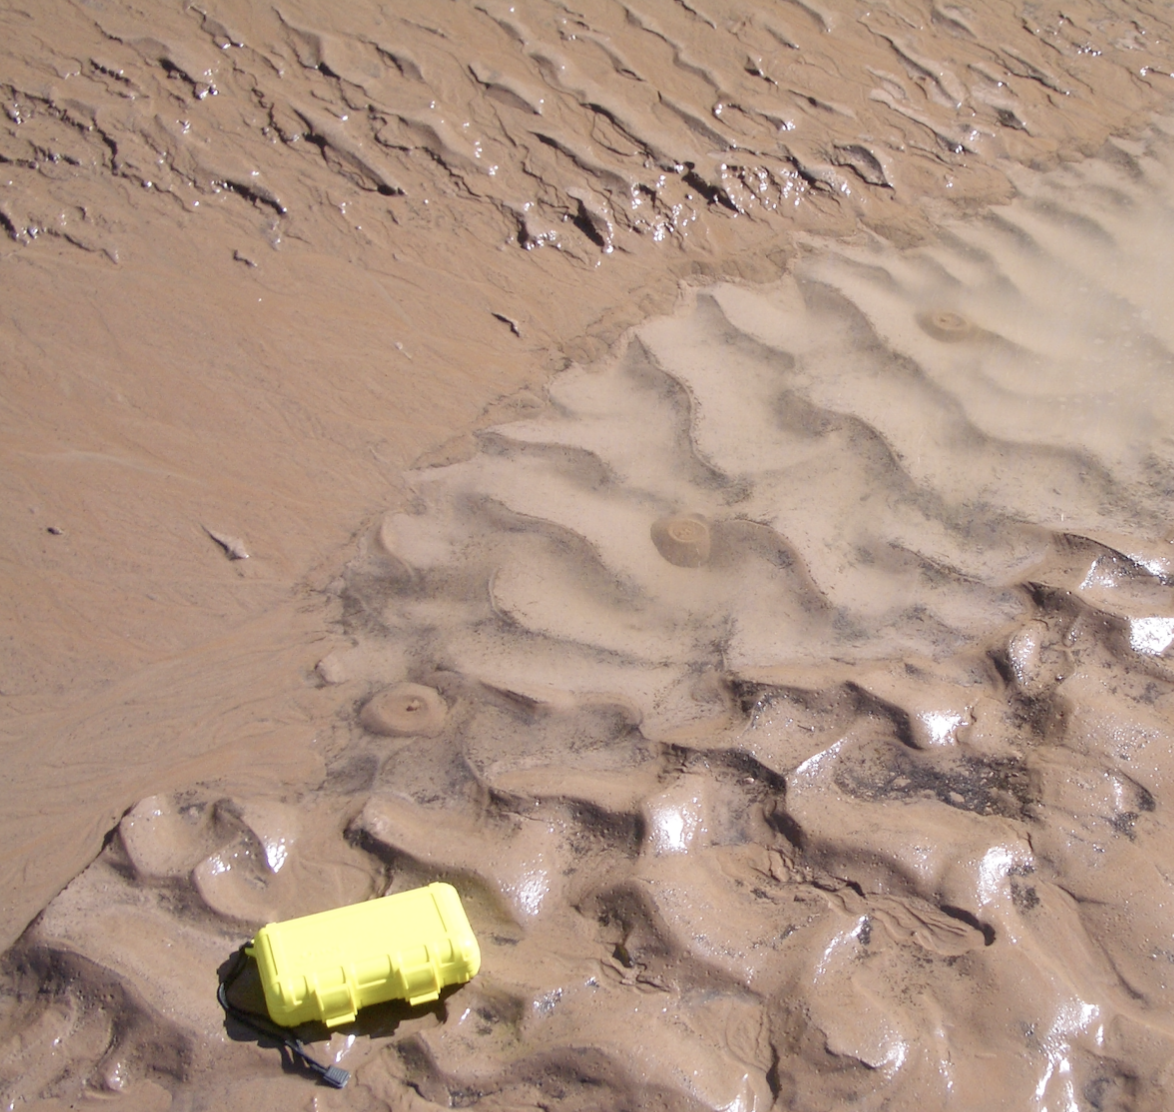
Figure 4. Several boils seeping from the sandbar immediately upstream of Crystal Rapid at a flow of approximately 8,000 cfs (the current low flow level). The yellow case is approximately 6.5 inches by 4 inches.